Appendix B — Practice: Regression
The objective of this practice is to consolidate the knowledge acquired about regression.
B.1 Deliverables
You must submit a PDF document containing the entire data analysis process related to the questions posed in the Exercises section below.
To generate the PDF document, you must use R Markdown or Quarto. This allows you to easily interweave explanations and code with results.
The PDF document will be uploaded to a task in the virtual campus.
B.2 Dataset
We will explore a dataset of volumetric brain measurements of a number of individuals, which fall into two groups (according to the variable CLASS): the value HEALTHY indicates a healthy individual, while the value AD indicates Alzheimer’s disease (AD stands for Alzheimer’s Disease).
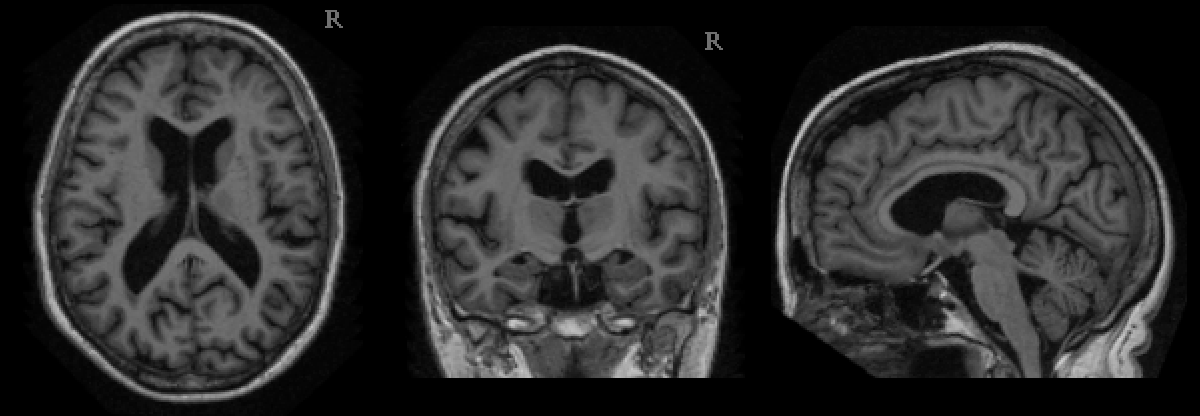
These data come from calculating around 230 morphometric estimates (volume and thickness of anatomical brain regions) of some 260 individuals, belonging to the OASIS project.
B.3 Objective
The purpose of this project is to use the advanced statistical techniques seen in class to:
- Establish the existing relationship between volumetric variables and the age and sex of each individual.
- Discover markers among volumetric measures of cognitive status (healthy, Alzheimer’s)
- Generate a classifier model of cognitive status to predict, from the volumetric variables, whether an individual has Alzheimer’s or is healthy.
- Conduct a small Bayesian analysis of the epidemiology/incidence of Alzheimer’s disease.
B.4 Exercises
Import the dataset Alzheimer.csv. (Help: use read_csv() from the readr package).
Answer the following questions and accompany them with explanatory graphs where appropriate.
B.4.1 Descriptive statistics
The first step is to understand the dataset and become familiar with it.
- What types of variables appear in the dataset? For numeric variables, perform a brief descriptive statistic (Help: use
summary()).
B.4.2 Hypothesis testing
We aim to establish markers or indicators of an individual’s condition. Basically, we want to test whether brain atrophy is specific to Alzheimer’s disease, compared to healthy subjects.
- For the two groups,
HEALTHYandAD, you want to test (by appropriate hypothesis tests) whether the brain volume variable (BRAIN_VOLUME) is significantly lower in subjects with Alzheimer’s disease than in healthy subjects (perform a separate analysis for each of the sexes in the dataset). Accompany with aboxplot()to observe the differences. (Help: use thefilter()function of thedplyrpackage to filter the dataset to leave only one sex, perform the hypothesis test, and repeat with the other sex). - Repeat the above analysis, but to test whether the grey matter or white matter volume variables are different between healthy subjects and subjects with AD (perform one test for each variable). (Help: Simply repeat the previous step, with minimal changes).
Is the incidence of the disease different in patients of different sexes?
- Are the variables
SEXandCLASSindependent? Use a \(\chi^2\) test to test for independence and correlation between the two.
B.4.3 Regression
We are considering establishing a pattern of annual (i.e. age-dependent) atrophy in the brain. How does the volume of the brain vary with age?
- We want to establish a regression model that uses as predictors the variables sex and age to estimate the value of brain volume (variable
BRAIN_VOLUME). Use simple linear and polynomial regression and compare the models usinganova(), detecting if all variables are significant and commenting and interpreting the known goodness-of-fit and error measures. - Repeat the previous step to find models to estimate the variable
GM_VOLUME(grey matter volume) and models to estimateWM_VOLUME(white matter volume) from age and sex.
On the other hand, we want to know whether the volumetric parameters of the brain are good indicators of age.
- The inverse analysis to the previous ones is proposed. Using as predictors the variables of brain volume, grey and white matter, as well as sex, study regression models (at least 3, taking into account possible interactions and creating a polynomial model, as a minimum) where the age of the individual in question is estimated. Also, accompany with graphs. Establish which of the models is the best fit using the most appropriate functions and measures.
B.4.4 Logistic regression and classification
We want to be able to decide, on the basis of the brain volumetry data we are looking at, whether a new subject may have Alzheimer’s disease.
To do so, we will build logistic regression and classification models to solve this problem.
We need to split the dataset into a training set with 80% of the data, randomly selected, and the remaining 20% to validate the models.
Create a suitable logistic regression model (especially one in which the predictors are significant) for the
CLASSvariable. How accurate is this model if we run it (usingpredict()) on the validation set?